Tuesday, September 27, 2011

Meet the Altova Team at Oracle OpenWorld

clip_image002Some people say early October brings the most enjoyable weather to San Francisco, and Oracle OpenWorld and JavaOne will make things even better this year from Oct. 2 – 6. If you’re traveling to the City by the Bay for either event, plan to visit the Altova team at booth 106 in the Moscone South Oracle OpenWorld exhibit hall.

We’ll be demonstrating all the tools in the Altova MissionKit with special emphasis on multi-database support, tools for working with XML in databases, and solutions for compliance with XBRL, NIEM, HL7, EDI, QR codes, and many other industry standards.

Here’s your chance for a personal tour of that Altova tool or feature you’ve been curious to see – whether it’s advanced charting in StyleVision, Java code generation from UML in UModel, or refactoring XML Schemas in XMLSpy. We always enjoy meeting users face to face and hearing about the projects you’re working on too!

You can also enter our Altova product raffle for a chance to win a license for Altova MapForce 2011 Basic Edition. We hope to see you there!

clip_image003

Tuesday, September 20, 2011

Leverage Your Financial Data with the XBRL Chart Wizard–Part 2

Extensible Business Reporting Language (XBRL) is an XML-based language for reporting and exchanging financial data that’s making inroads across the globe. In fact the US Securities and Exchange Commission now requires public companies to submit financial data in XBRL format.

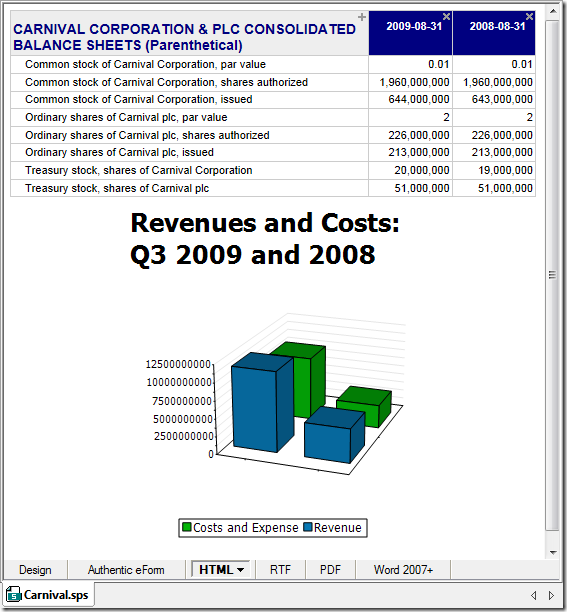
Altova’s MissionKit, a suite of our most popular software, supports XBRL tagging via XMLSpy and MapForce as well as XBRL rendering via StyleVision. With StyleVision you can create sophisticated financial reports including charts and tables based on XBRL instance files.

image

This is the second post in our two part series on StyleVision’s XBRL chart capabilities. In our last post we showed you how to call the XBRL Chart Wizard and create pie charts. This time we’ll show you how to create bar charts and line charts.

Tuesday, September 13, 2011

Leverage Your Financial Data with the XBRL Chart Wizard–Part 1

Extensible Business Reporting Language (XBRL), an XML-based language for financial data, is increasingly being used by both public and private organizations across the globe – in fact it is mandated for some companies in countries including the United Kingdom and the United States.

Altova provides comprehensive support for XBRL tagging and XBRL reporting with the MissionKit, a suite of our most popular software. Among the MissionKit tools is StyleVision, a graphical stylesheet designer and report builder, which can be used to support a host of internal reporting and analysis activities for companies that use XBRL.

clip_image001

In the next post we’ll focus on StyleVision’s XBRL Chart Wizard, a powerful XBRL visualization tool that can turn your XBRL-tagged financial data into powerful charts and graphs – if a picture is worth 1,000 words then StyleVision is worth its weight in gold.